UNAUDITED CONDENSED INTERIM FINANCIAL STATEMENTS FOR THE SIX MONTHS PERIOD ENDED 31 DECEMBER 2025
Financials Archive![]() Note: Files are in Adobe (PDF) format.
Note: Files are in Adobe (PDF) format.
Please download the free Adobe Acrobat Reader to view these documents.
CONDENSED INTERIM CONSOLIDATED STATEMENT OF COMPREHENSIVE INCOME
CONDENSED INTERIM STATEMENTS OF FINANCIAL POSITION
Review of Performance of the Group
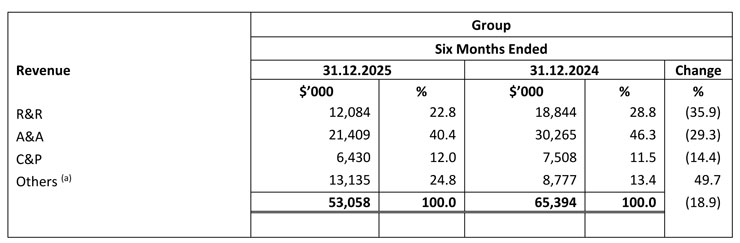
(a) Others revenue streams included home retrofitting services, landscaping works, interior design services, mechanical and electrical engineering works, renewable energy solutions, vector control services, and handyman services.
Condensed Interim Consolidated Statement of Comprehensive income
Revenue
1HY2026 vs 1HY2025
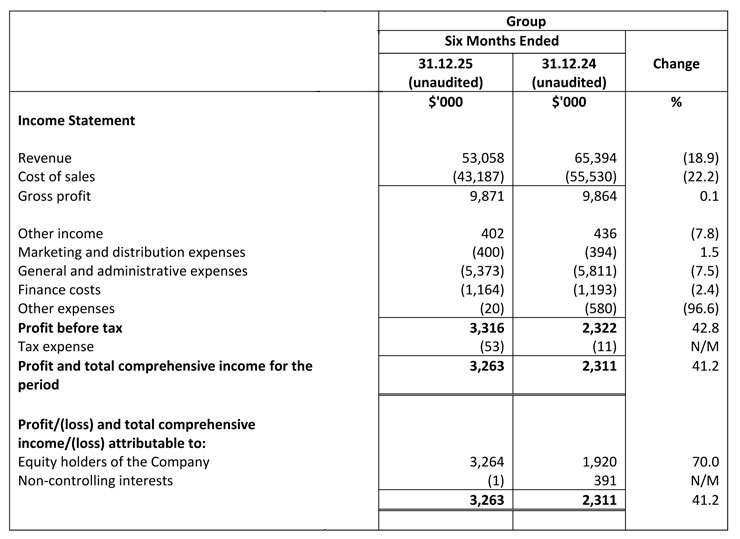
Revenue decreased by $12.3 million or 18.9% from $65.3 million in 1HY2025 to $53.0 million in 1HY2026. The decrease was mainly attributable to lower revenue contributions from the A&A business segment due to the schedule of contract completions, many of which are expected to be delivered in the second half of the financial year.
Gross profit and gross profit margin
1HY2026 vs 1HY2025
There were no material changes in the Group’s gross profit in 1HY2026. Despite the decrease in revenue, the gross profit margin has improved from 15.1% in 1HY2025 to 18.6% in 1HY2026, this was due to the fall in cost of goods which reflected the costs savings in worker’s housing from the conversion of one floor of our headquarters into a dormitory for foreign workforce.
Other income
1HY2026 vs 1HY2025
There were no material changes in the Group’s other income in 1HY2026.
Marketing and distribution expenses
1HY2026 vs 1HY2025
There were no material changes in the Group’s marketing and distribution expenses in 1HY2026.
General and administrative expenses
1HY2026 vs 1HY2025
The general and administrative expenses decreased by $0.5 million or 7.5% from $5.8 million in 1HY2025 to $5.3 million in 1HY2026 mainly due to lower legal and professional fees incurred.
Finance costs
1HY2026 vs 1HY2025
There were no material changes in the Group’s finance costs during 1HY2026.
Other expenses
1HY2026 vs 1HY2025
Other expenses decreased by $0.5 million or 96.6% from $0.6 million in 1HY2025 to $0.1 million in 1HY2026 mainly due to share-based payment compensation under the ISOTeam PSP2023 in 1HY2025.
Profit before tax
1HY2026 vs 1HY2025
As a result of the above, the Group recorded a profit before tax of $3.3 million in 1HY2026 as compared to $2.3 million in 1HY2025.
Tax credit and Profit after tax
1HY2026 vs 1HY2025
There were no material changes in the Group’s tax expense in 1HY2026. Accordingly, the Group recorded a profit after tax of $3.3 million in 1HY2026 as compared to $2.3 million in 1HY2025.
Condensed Interim Statements of Financial Position
Non-current assets
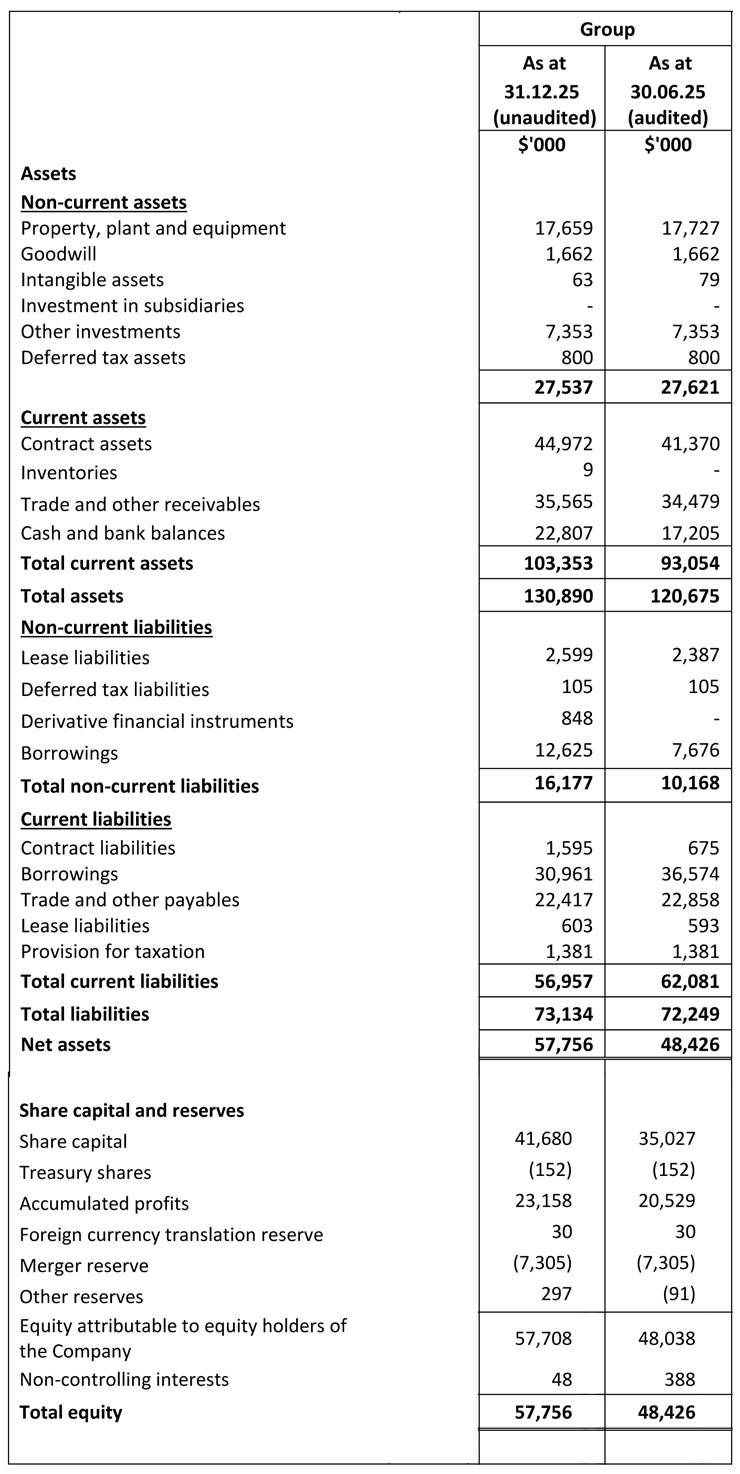
Non-current assets decreased by $0.1 million or 0.3% from $27.6 million as at 30 June 2025 to $27.5 million as at 31 December 2025, mainly due to decrease in property, plant and equipment as a result of depreciation charges.
Current assets
Current assets increased by $10.2 million or 10.9% from $93.1 million as at 30 June 2025 to $103.3 million as at 31 December 2025 mainly due to an increased in cash and bank balances as a result of shares placement and the issuance of convertible bonds.
Non-current liabilities
The increased in non-current liabilities of $6.0 million or 59.1% from $10.2 million as at 30 June 2025 to $16.2 million as at 31 December 2025 was mainly due to increase in borrowings and the issuance of convertible bonds.
Current liabilities
The decreased in current liabilities of $5.1 million or 8.3% from $62.1 million as at 30 June 2025 to $57.0 million as at 31 December 2025 was mainly due to repayment of trade and other payables and borrowings.
Condensed Interim Consolidated Statement of Cash Flows
Net cash generated from operating activities
1HY2026
Net cash generated from operating activities amounted to $0.9 million in 1HY2026 was mainly due to increase in contract assets and trade and other receivables which were partially offset by the increase in contract liabilities.
Net cash used in from investing activities
1HY2026
Net cash used in investing activities amounted to $0.4 million in 1HY2026 was mainly due to purchases of plant and equipment such as motor vehicles and equipment.
Net cash generated from financing activities
1HY2026
Net cash generated from financing activities of $3.0 million in 1HY2026 was mainly attributable to proceeds from borrowings, share issuance and convertible bonds, partially offset by repayment of borrowings, interest payments and dividends.
Commentary
According to the Building and Construction Authority (BCA), Singapore’s Built Environment sector is set to maintain its momentum in 2026, total construction demand to remain steady at S$47-53 billion in nominal terms for 2026, similar to 2025. At the BCA and Real Estate Developers’ Association of Singapore (REDAS) Built Environment and Real Estate Prospects Seminar 2026, Minister for National Development, Mr Chee Hong Tat, announced new support for the Built Environment (BE) firms to improve productivity and streamlined regulations to help firms save time, cost and manpower. The sustained construction demand expected in 2026 is supported by the expected awarding of additional construction packages for Changi Terminal 5 (T5) Development, for Marina Bay Sands Integrated Resort (MBS IR2) expansion, New Tengah General & Community Hospital, Downtown Line 2 Extension and Thomson-East Coast Line Extension. #
In light of the above, the Group remains cautiously optimistic of the market conditions in the construction sector. As at the date of this announcement, the order book of the Group stands at $176.2 million. The Group will selectively tender for public and private sector projects, taking into consideration the prevailing market conditions including rising manpower and material costs. Accordingly, the Group continues to prioritise cash conservation and cost control.